PH
PHWSODownload
Established
Geochemical & Geostatistical Analysis with ioGAS/ArcGIS Pro
Published 6/2026
MP4 | Video: h264, 1920x1080 | Audio: AAC, 44.1 KHz, 2 Ch
Language: English + subtitle | Duration: 6h 42m | Size: 5.57 GB
Learn how to process surface geochemical data since importing and validating your data to robust multivariate algorithms
What you'll learn
Analyze soil data using univariate, bivariate, and multivariate unsupervised machine learning
Define the background, threshold and anomaly values for surface geochemical data
Variography and Geostatistical analysis for geochemical data using ArcGIS Pro
Interpolate geochemical data using Ordinary Kriging to generate anomaly maps
Requirements
Primary and Secondary geochemical dispersion processes
Basic knowledge of Statistics and Geostatistics
Geochemical zonation of ore deposits
Description
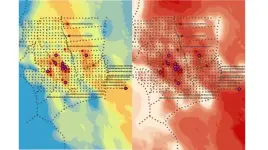
This course focuses on teaching a workflow that enables geologists and geochemists to perform a geochemical data analysis from zero to hero. While this course uses soil data, the same workflow can be applied to any type of geochemical data used in mineral exploration. Geochemical analysis goes hand in hand with a thorough statistical analysis that allows each variable under study to be characterized from a univariate perspective-that is, to understand the distribution of the data-as well as through bivariate, trivariate, and multivariate analyses using a powerful software such as ioGAS. Bivariate analysis reveals the relationship between two chemical elements, trivariate analysis extends this to three, and multivariate analysis captures the relationships among a larger number of elements. These chemical elements can be properly handled once it is understood that the data is compositional in nature and that all elements share geochemical affinities that can be detected using unsupervised classification methods through machine learning. Finally, all of these analyses must be reflected spatially, which is why a GIS software-ArcGIS Pro-has been incorporated into the workflow. After conducting a variographic analysis, the data can be interpolated using Ordinary Kriging to produce a geochemical anomaly map that describes the anisotropy of the regionalized variables.
Who this course is for
Geologists and geochemists who want to learn how to work with geochemical data and deliver robust results
DOWNLOAD LINKS
Rapidgator
You do not have permission to view the full content of this post. Log in or register now.
You do not have permission to view the full content of this post. Log in or register now.
You do not have permission to view the full content of this post. Log in or register now.
You do not have permission to view the full content of this post. Log in or register now.
You do not have permission to view the full content of this post. Log in or register now.
You do not have permission to view the full content of this post. Log in or register now.
AlfaFile
You do not have permission to view the full content of this post. Log in or register now.
You do not have permission to view the full content of this post. Log in or register now.
You do not have permission to view the full content of this post. Log in or register now.
You do not have permission to view the full content of this post. Log in or register now.
You do not have permission to view the full content of this post. Log in or register now.
You do not have permission to view the full content of this post. Log in or register now.