 PH
PH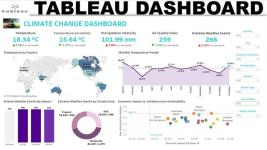
Advanced Tableau For Climate Professionals
Released 09/2025
With Harim Jung
MP4 | Video: h264, 1280x720 | Audio: AAC, 44.1 KHz, 2 Ch
Skill level: Advanced | Genre: eLearning | Language: English + subtitle | Duration: 1h 58m 35s | Size: 277 MB
Master advanced Tableau features like Level of Detail (LOD), parameters, and KPI cards to build a dynamic carbon emission tracking dashboard for climate reporting.
Course details
This course is designed for climate professionals who want to master advanced Tableau techniques to track emissions, analyze trends, and build carbon emission tracking (net-zero) dashboards. Instructor Harim Jung shows you how to use Level of Detail (LOD) calculations, dynamic parameters, and dual-axis charts to build powerful, data-rich visuals. Explore the essentials of blending emissions, GDP, and population data to compute and visualize key metrics like CO2 per capita and CO2 per GDP. Along the way, learn how to create interactive dashboards with year-over-year (YoY) KPI cards, sector breakdowns, and regional filters to support high-impact reporting. By the end of this course, you'll be equipped with the skills you need to automate insights, optimize climate visuals, and lead data-driven sustainability decisions.
Homepage
You do not have permission to view the full content of this post. Log in or register now.
You do not have permission to view the full content of this post. Log in or register now.